


| German Version |
Skin cancer is the most commonly diagnosed cancer worldwide. However, if detected early, it can be one of the easiest to cure. With this in mind, Derma.plus developed the following study to
better understand the geographical and geopolitical factors which make skin cancer incidences more common, and sometimes deadly, in certain regions over others.
The study is divided into two sections: first, the Skin Cancer Susceptibility Index analyses the UV factor, the skin-tone by demographic percentages and rate of incidences from a range of countries to identify geographically where the highest rates of skin cancer are most likely to occur. Secondly, the Socioeconomic Treatment Index cross references national health spending and individual income against mortality rates to better understand the efforts undertaken worldwide to combat the disease.
“The incidence of both non-melanoma and melanoma skin cancers has increased dramatically over the past decades,” states Prof. Dietrick Abeck, Chief Medical Advisor for Derma.plus. “Worldwide, more than 3-million non-melanoma skin cancers and 150,000 melanoma skin cancers are diagnosed each year. One in every three cancers diagnosed is a skin cancer.”
Index: Skin Cancer Suceptibility
| Country | Region | Skin cancer incidence score | Melanoma diseases per year | UV factor score | Skin factor score | |
|---|---|---|---|---|---|---|
| 1 | New Zealand | Oceania | 10 | 2473 | 6.88 | 4.75 |
| 2 | Australia | Oceania | 9.67 | 12265 | 7.35 | 5.75 |
| 3 | Switzerland | Europe | 5.89 | 2484 | 2.8 | 7.75 |
| 4 | Sweden | Europe | 5.79 | 2911 | 1.28 | 9.75 |
| 5 | Norway | Europe | 5.71 | 1506 | 1 | 10 |
| 6 | Netherlands | Europe | 5.6 | 4804 | 2.42 | 8.75 |
| 7 | Denmark | Europe | 5.57 | 1596 | 2.23 | 8.25 |
| 8 | Slovenia | Europe | 5.19 | 533 | 2.99 | 7.5 |
| 9 | USA | North America | 4.62 | 72000 | 4.98 | 6 |
| 10 | Great Britain | Europe | 4.6 | 14445 | 2.33 | 9.25 |
| 11 | Finland | Europe | 4.59 | 1208 | 1.19 | 9.5 |
| 12 | Czech | Europe | 4.38 | 2194 | 2.61 | 6.75 |
| 13 | Germany | Europe | 4.36 | 16884 | 2.42 | 7.25 |
| 14 | Ireland | Europe | 4.02 | 859 | 2.04 | 8.25 |
| 15 | Belgium | Europe | 3.79 | 1941 | 2.61 | 7.25 |
| 16 | Austria | Europe | 3.51 | 1334 | 2.42 | 6.75 |
| 17 | Iceland | Europe | 3.49 | 51 | 1.09 | 8.5 |
| 18 | France | Europe | 3.48 | 9871 | 2.52 | 5.25 |
| 19 | Canada | North America | 3.41 | 5382 | 1.66 | 7.25 |
| 20 | Slovakia | Europe | 3.41 | 806 | 2.33 | 6.5 |
| 21 | Serbia | Europe | 3.32 | 1016 | 3.27 | 5.75 |
| 22 | Estonia | Europe | 3.04 | 166 | 1.66 | 8.5 |
| 23 | Latvia | Europe | 2.84 | 225 | 1.95 | 8 |
| 24 | Hungary | Europe | 2.84 | 1117 | 2.42 | 5.75 |
| 25 | Spain | Europe | 2.74 | 5004 | 4.03 | 3.75 |
| 26 | Lithuania | Europe | 2.53 | 275 | 2.33 | 7.5 |
| 27 | Croatia | Europe | 2.39 | 365 | 3.08 | 5 |
| 28 | Malta | Europe | 2.37 | 36 | 5.17 | 4.5 |
| 29 | Italy | Europe | 2.35 | 5124 | 4.03 | 4.75 |
| 30 | Israel | Middle East | 2.13 | 593 | 6.02 | 5.25 |
| 31 | Macedonia | Europe | 2.13 | 144 | 3.37 | 4.75 |
| 32 | Poland | Europe | 2.08 | 2583 | 2.23 | 7.5 |
| 33 | Ukraine | Europe | 2.04 | 2792 | 2.33 | 7 |
| 34 | Bulgaria | Europe | 1.98 | 439 | 3.94 | 5.25 |
| 35 | Russia | Europe / Asia | 1.95 | 8717 | 1.19 | 8 |
| 36 | Cyprus | Europe | 1.95 | 52 | 5.17 | 3.5 |
| 37 | Romania | Europe | 1.91 | 1121 | 3.27 | 4.75 |
| 38 | Portugal | Europe | 1.72 | 464 | 4.69 | 3.5 |
| 39 | Greece | Europe | 1.7 | 472 | 4.51 | 4 |
| 40 | Montenegro | Europe | 1.59 | 23 | 3.75 | 4.75 |
| 41 | South Africa | Africa | 1.54 | 1858 | 7.25 | 4 |
| 42 | Argentina | South America | 1.52 | 1460 | 3.65 | 4.25 |
| 43 | Colombia | South America | 1.49 | 1488 | 9.72 | 1.5 |
| 44 | Brazil | South America | 1.47 | 6174 | 9.05 | 2 |
| 45 | Bosnia and Herzegovina | Europe | 1.44 | 106 | 3.27 | 5.75 |
| 46 | Turkey | Europe / Asia | 1.31 | 1552 | 4.32 | 4 |
| 47 | Chile | South America | 1.28 | 331 | 4.41 | 2.75 |
| 48 | Mexico | Central America | 1.26 | 2031 | 7.35 | 3.75 |
| 49 | Albania | Europe | 1.2 | 38 | 3.84 | 4.75 |
| 50 | South Korea | Asia | 1.2 | 649 | 4.79 | 3 |
| 51 | Japan | Asia | 1.16 | 1371 | 5.07 | 3.5 |
| 52 | China | Asia | 1.1 | 9814 | 5.45 | 4.25 |
| 53 | Iran | Middle East | 1.1 | 531 | 5.17 | 2.75 |
| 54 | Indonesia | Asia | 1.05 | 1069 | 10 | 1.25 |
| 55 | Philippines | Asia | 1.03 | 298 | 8.48 | 2.25 |
| 56 | Nigeria | Africa | 1.02 | 436 | 9.43 | 1 |
| 57 | Saudi Arabia | Middle East | 1.02 | 58 | 7.35 | 2.75 |
| 58 | Pakistan | Middle East | 1.02 | 325 | 6.21 | 3 |
| 59 | India | Asia | 1.02 | 2100 | 7.82 | 2.25 |
| 60 | Egypt | Middle East | 1 | 119 | 6.59 | 2.75 |
| 61 | Iraq | Middle East | 1 | 49 | 5.64 | 2.75 |
| 62 | Bangladesh | Asia | 1 | 153 | 7.54 | 2 |
Socioeconomic Treatment Index
| Country | Mortality | Inequality in life expectancy | National Health Expenditure | Rating | |
|---|---|---|---|---|---|
| 1 | Sweden | 17.00% | 3.11 | 4.20 | 8.4 |
| 2 | Switzerland | 15.00% | 3.92 | 2.81 | 8.4 |
| 3 | Italy | 14.00% | 3.35 | 6.32 | 8.9 |
| 4 | Denmark | 14.00% | 3.96 | 4.28 | 9.0 |
| 5 | Germany | 16.00% | 3.68 | 4.93 | 9.2 |
| 6 | Norway | 22.00% | 3.36 | 3.44 | 9.3 |
| 7 | Australia | 13.00% | 4.21 | 4.98 | 9.3 |
| 8 | Belgium | 15.00% | 3.92 | 5.28 | 9.4 |
| 9 | Finland | 18.00% | 3.53 | 5.82 | 9.4 |
| 10 | Iceland | 25.00% | 2.82 | 6.13 | 9.4 |
| 11 | Ireland | 16.00% | 3.70 | 6.25 | 9.6 |
| 12 | Netherlands | 18.00% | 3.87 | 4.76 | 9.7 |
| 13 | Czech | 15.00% | 3.67 | 7.84 | 9.8 |
| 14 | France | 19.00% | 4.01 | 4.92 | 9.9 |
| 15 | Spain | 19.00% | 3.86 | 6.61 | 10.1 |
| 16 | New Zealand | 15.00% | 4.77 | 5.19 | 10.3 |
| 17 | Great Britain | 15.00% | 4.48 | 6.14 | 10.3 |
| 18 | Portugal | 23.00% | 3.91 | 6.72 | 10.5 |
| 19 | Slovenia | 24.00% | 3.79 | 6.94 | 10.5 |
| 20 | Israel | 24.00% | 3.80 | 7.21 | 10.5 |
| 21 | Austria | 27.00% | 3.74 | 4.76 | 10.7 |
| 22 | Canada | 21.00% | 4.63 | 4.78 | 10.8 |
| 23 | USA | 14.00% | 6.19 | 1.20 | 10.9 |
| 24 | Cyprus | 27.00% | 3.72 | 7.58 | 10.9 |
| 25 | Malta | 17.00% | 4.76 | 6.81 | 11.0 |
| 26 | South Korea | 41.00% | 3.87 | 7.81 | 12.4 |
| 27 | Croatia | 26.00% | 5.20 | 7.87 | 12.4 |
| 28 | Greece | 43.00% | 4.03 | 6.96 | 12.5 |
| 29 | Japan | 50.00% | 3.23 | 5.64 | 12.6 |
| 30 | Slovakia | 23.00% | 5.61 | 7.64 | 12.7 |
| 31 | Hungary | 31.00% | 5.40 | 7.97 | 13.2 |
| 32 | Estonia | 34.00% | 5.61 | 8.39 | 13.7 |
| 33 | Chile | 37.00% | 5.94 | 8.07 | 14.2 |
| 34 | Poland | 52.00% | 5.70 | 8.38 | 15.2 |
| 35 | Bosnia and Herzegovina | 47.00% | 6.68 | 7.63 | 15.2 |
| 36 | Lithuania | 39.00% | 6.62 | 8.30 | 15.3 |
| 37 | Montenegro | 30.00% | 7.64 | 8.53 | 15.6 |
| 38 | Latvia | 38.00% | 7.57 | 8.59 | 16.3 |
| 39 | Macedonia | 47.00% | 7.57 | 8.67 | 16.6 |
| 40 | Serbia | 34.00% | 8.53 | 7.43 | 16.7 |
| 41 | Bulgaria | 43.00% | 7.86 | 8.25 | 16.8 |
| 42 | Romania | 32.00% | 8.76 | 8.88 | 17.3 |
| 43 | Saudi Arabia | 28.00% | 8.73 | 9.19 | 17.4 |
| 44 | Argentines | 39.00% | 9.27 | 8.83 | 18.2 |
| 45 | Russia | 42.00% | 9.84 | 8.28 | 19.3 |
| 46 | Ukraine | 40.00% | 10.39 | 8.43 | 19.3 |
| 47 | Mexico | 30.00% | 10.93 | 8.61 | 19.6 |
| 48 | Albania | 58.00% | 9.93 | 9.00 | 20.0 |
| 49 | China | 63.00% | 9.84 | 9.09 | 20.2 |
| 50 | Turkey | 41.00% | 11.05 | 8.92 | 20.5 |
| 51 | Iran | 39.00% | 12.47 | 8.43 | 22.0 |
| 52 | Colombia | 22.00% | 13.55 | 8.48 | 22.0 |
| 53 | Egypt | 45.00% | 13.43 | 9.17 | 23.4 |
| 54 | Brazil | 32.00% | 14.54 | 7.80 | 23.8 |
| 55 | Philippines | 46.00% | 15.19 | 9.43 | 25.5 |
| 56 | Indonesia | 51.00% | 16.44 | 9.96 | 27.5 |
| 57 | Iraq | 53.00% | 17.65 | 9.27 | 29.0 |
| 58 | Bangladesh | 62.00% | 20.09 | 9.94 | 32.3 |
| 59 | South Africa | 26.00% | 25.73 | 7.84 | 36.6 |
| 60 | India | 53.00% | 24.97 | 9.47 | 37.5 |
| 61 | Pakistan | 63.00% | 29.90 | 10.00 | 43.9 |
| 62 | Nigeria | 67.00% | 40.79 | 9.73 | 57.00 |
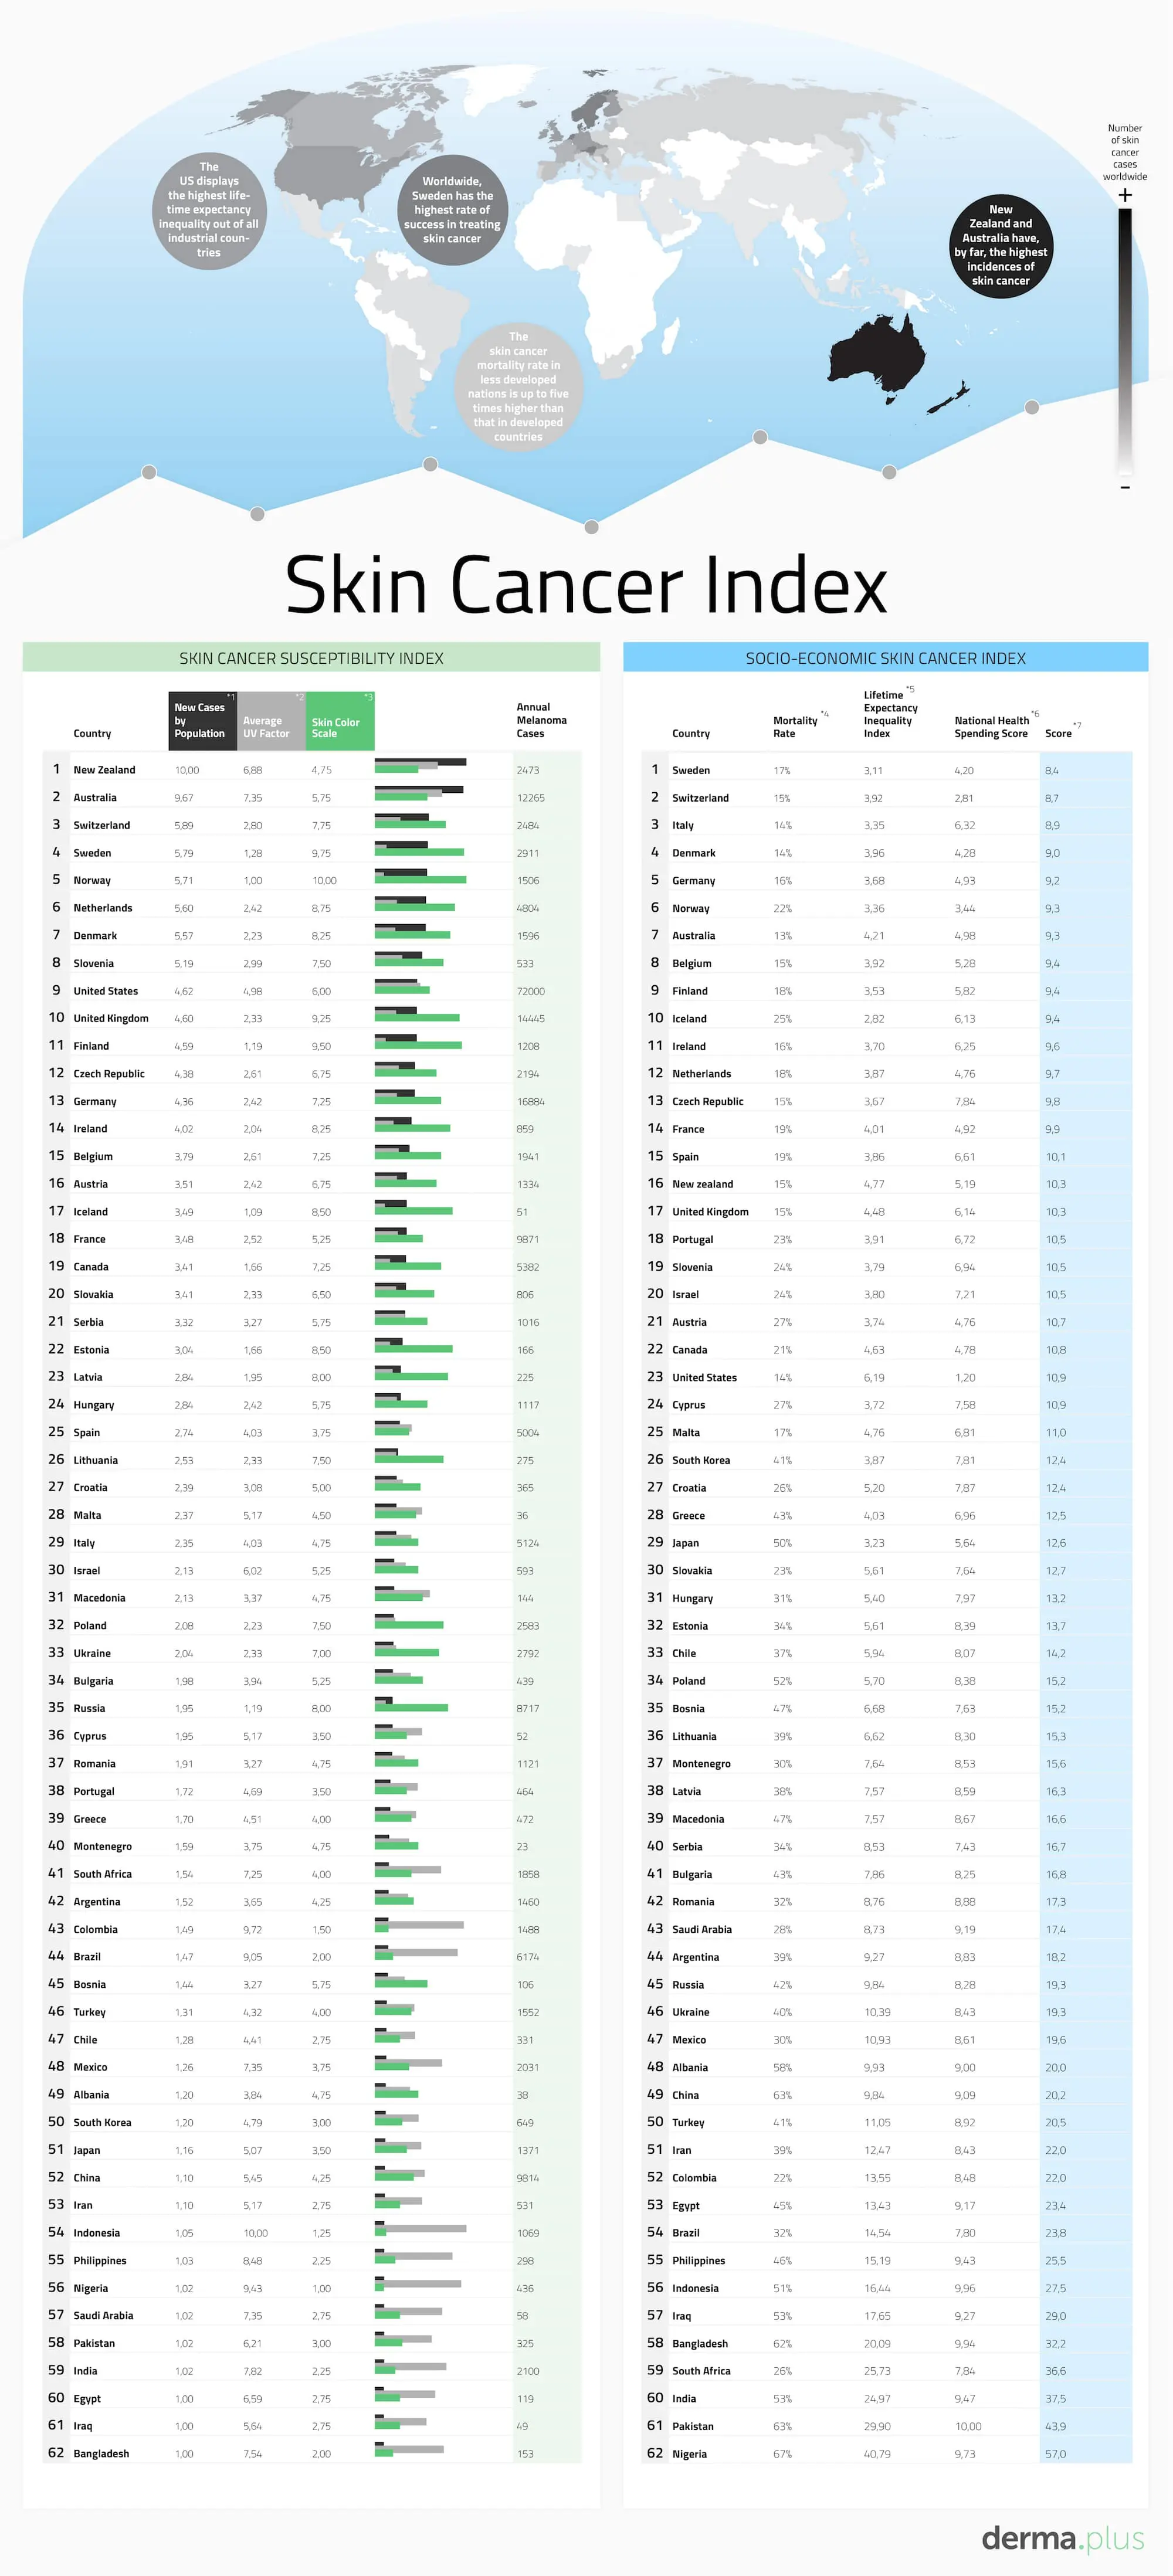
Brief explanation of the values
Skin cancer incidence score: Number of new skin cancers per year, measured by population (scaled from 1-10).
Average UV intensity: The value indicates the annual average intensity of UV radiation in the individual countries (scaled from 1-10, greater = stronger radiation).
Average skin type: Based on the Fitzpatrick scale, this value indicates how pigmented the population is on average (scaled from 1-10, larger = lighter skin and therefore more susceptible to skin cancer)..
Socio-economic index: In this part, for all figures, a smaller number represents a higher standard of treatment (smaller = better).
National health expenditure: The smaller the number, the more countries spend on the health system (scaled from 1-10, smaller = more).
Explanation and sources:
Skin cancer incidence score:
- New melanoma diseases per year, divided by population.
- Based on data from the WHO Globocan Report
Average UV intensity score:
- Intensity of UV radiation, year-round average, formed from data from the worldwide UV index of the Federal Ministry for Radiation Protection regarding the monthly radiation intensity.
- Values of missing countries found by approximation and with the help of UV radiation maps.
- Scaled from 1-10, with an increase in radiation intensity.
Average skin type score:
- Mean value of skin types according to the Fitzpatrick scale, determined using ethnic distribution and historical data of the countries.
- Scaled from 1-10, with decreasing pigmentation.
- Note: Average can be problematic if a large proportion of the population is at both ends of the spectrum.
Mortality:
- Skin cancer deaths per year divided by the number of new cases of skin cancer per year.
- Based on data from the WHO Globocan Report.
Inequality: Lifetime-expectancy (%):
- Shows the correlation of life expectancy and income in the different countries.
- Data based on Human Development Index.
National health expenditure:
- Share of GDP spent on the health system combined with the per capita expenditure of each country in $.
- Scaled from 1-10, with spending decreasing as the number increases.
- Based on World Bank data.
Overall standings:
- The lower the value, the better.
- Includes mortality, national health expenditure, inequality: life expectancy (%), and also a coefficient to assess the efficiency of national health systems (see below) in the following weighting: R=(((H1+H2+M)/5)+(I*5)+(E/10)) //R (Ranking), H1 (Health Expenditure in % of GDP, H2 (Health Expenditure per year per capita in constant $), M (Mortality Rate), I (Inequality in lifetime-expectancy), E (Efficiency of Health System, Survival Rate * Per Capita Expenditure (PPP)).
Tip: Our experts from derma.plus inform about many other dermatoses, nail diseases, hair diseases in the dermatology journal.